Mapping obstacles and free space within a milliwatt budget
A robot needs to know where obstacles are, where it can move, and which areas its sensors have not observed. An occupancy map records these occupied, free, and unexplored regions so the robot can check possible paths for collisions. These queries support motion planning and autonomous exploration.
Map construction can require repeated data transfers even when the final map is compact. Gleanmer limits this traffic by constructing compact map elements from each depth image and merging them directly into the stored map. These choices reduce the data retained and moved while the map is built.
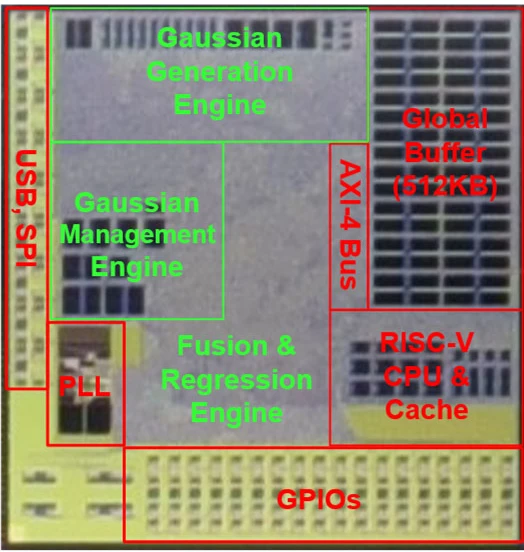
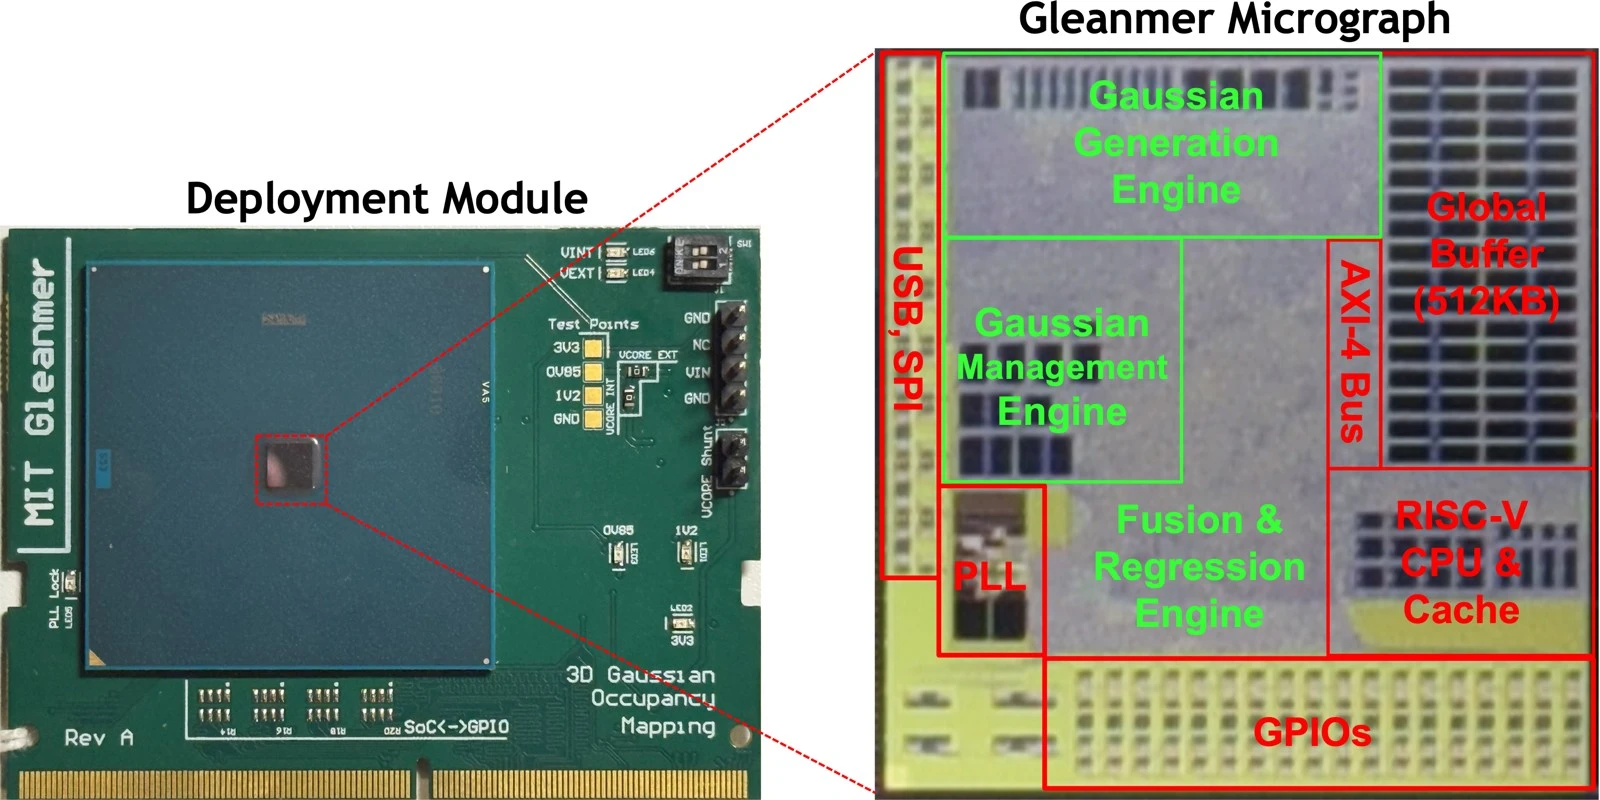
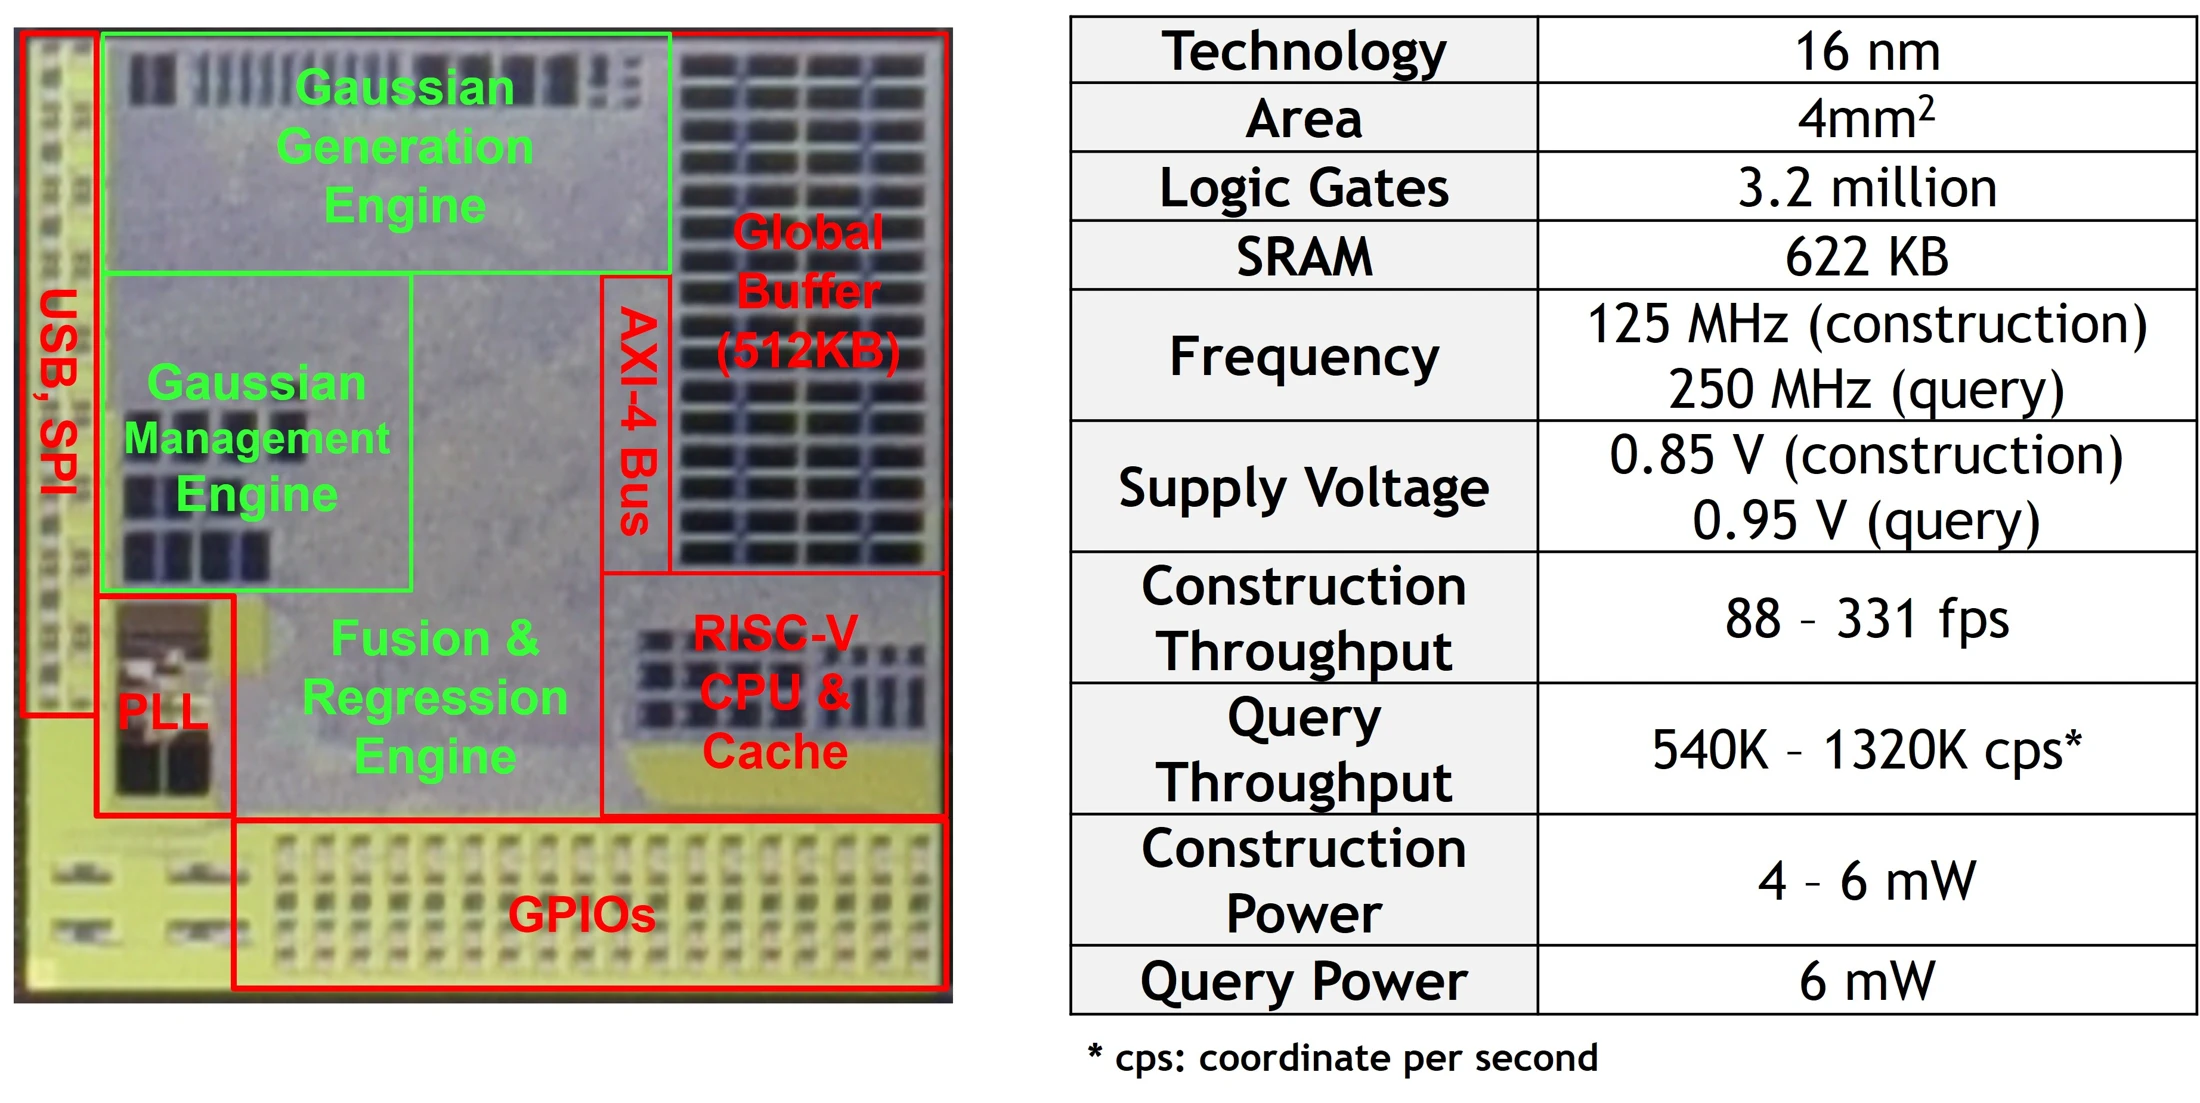
Gleanmer implements GMMap on a system-on-chip (SoC), a fabricated chip containing specialized processing engines and memory. It constructs and queries a 3D occupancy map under 6 mW of core power. Core power refers to the chip’s mapping circuitry. The reported figure excludes idle input/output and clock-generator power. Sensors, host computing, and the external test platform have separate power requirements.
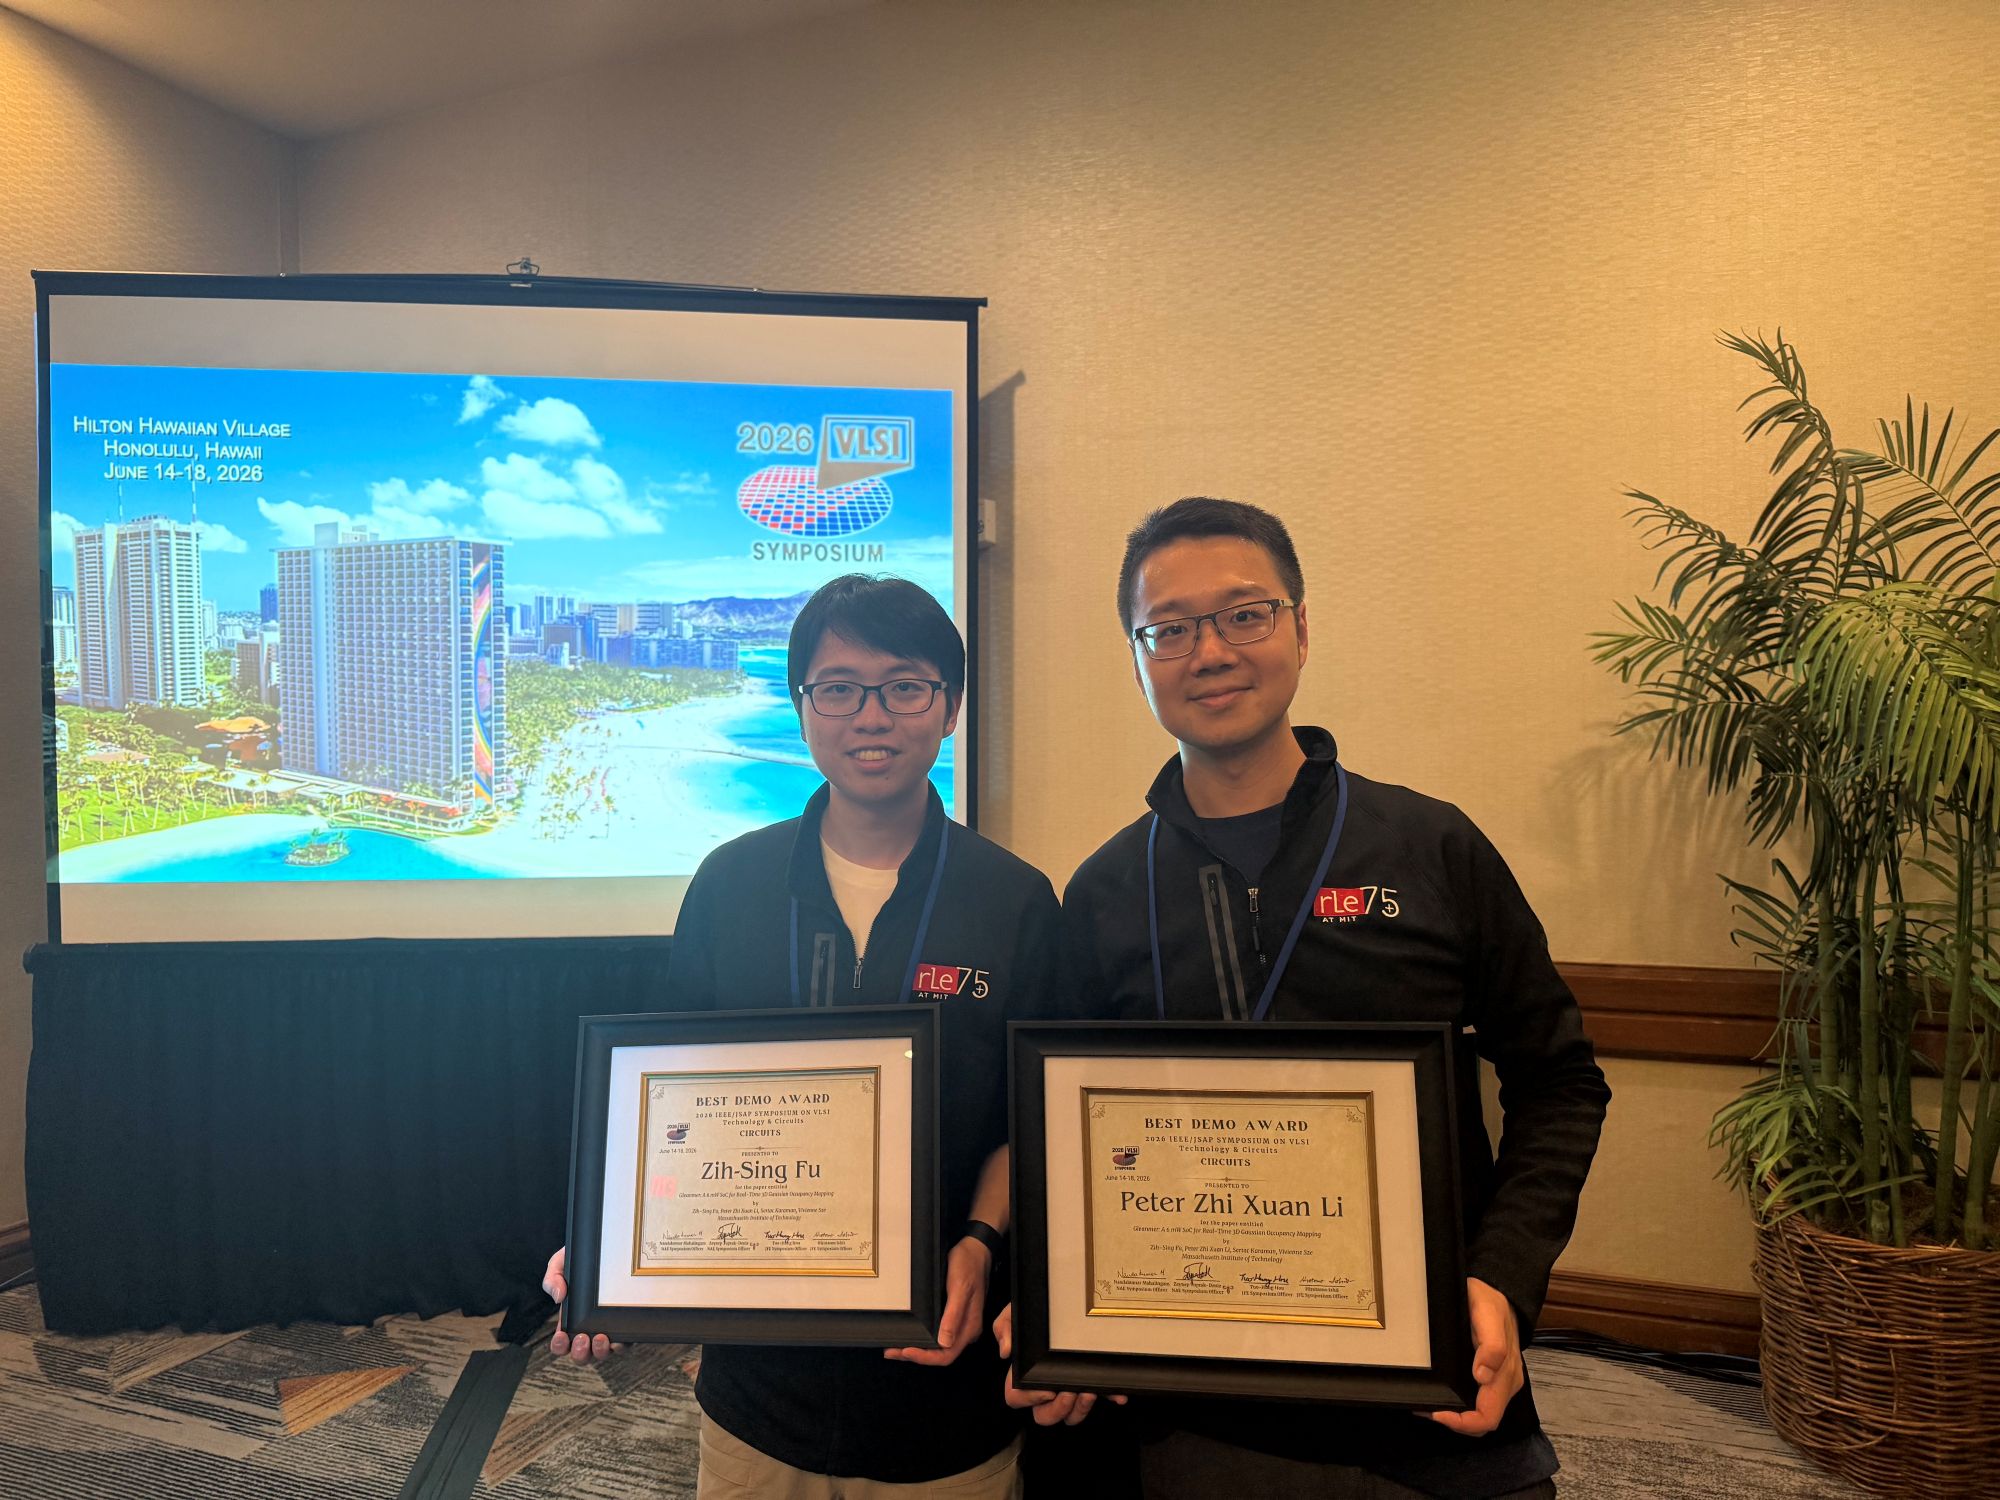
The work received the Best Demo Award at VLSI 2026.
From depth images to a Gaussian map
A depth image records the distance from a camera to visible surfaces. GMMap summarizes these measurements with Gaussian probability distributions, each described by a center, spread, and orientation in three dimensions. These Gaussians describe occupied and observed free regions, with their shapes adapting to the scene. The chip processes each image in one pass, converting pixels into line segments and then Gaussians. New Gaussians merge directly into the stored map without reconstructing the original sensor points.
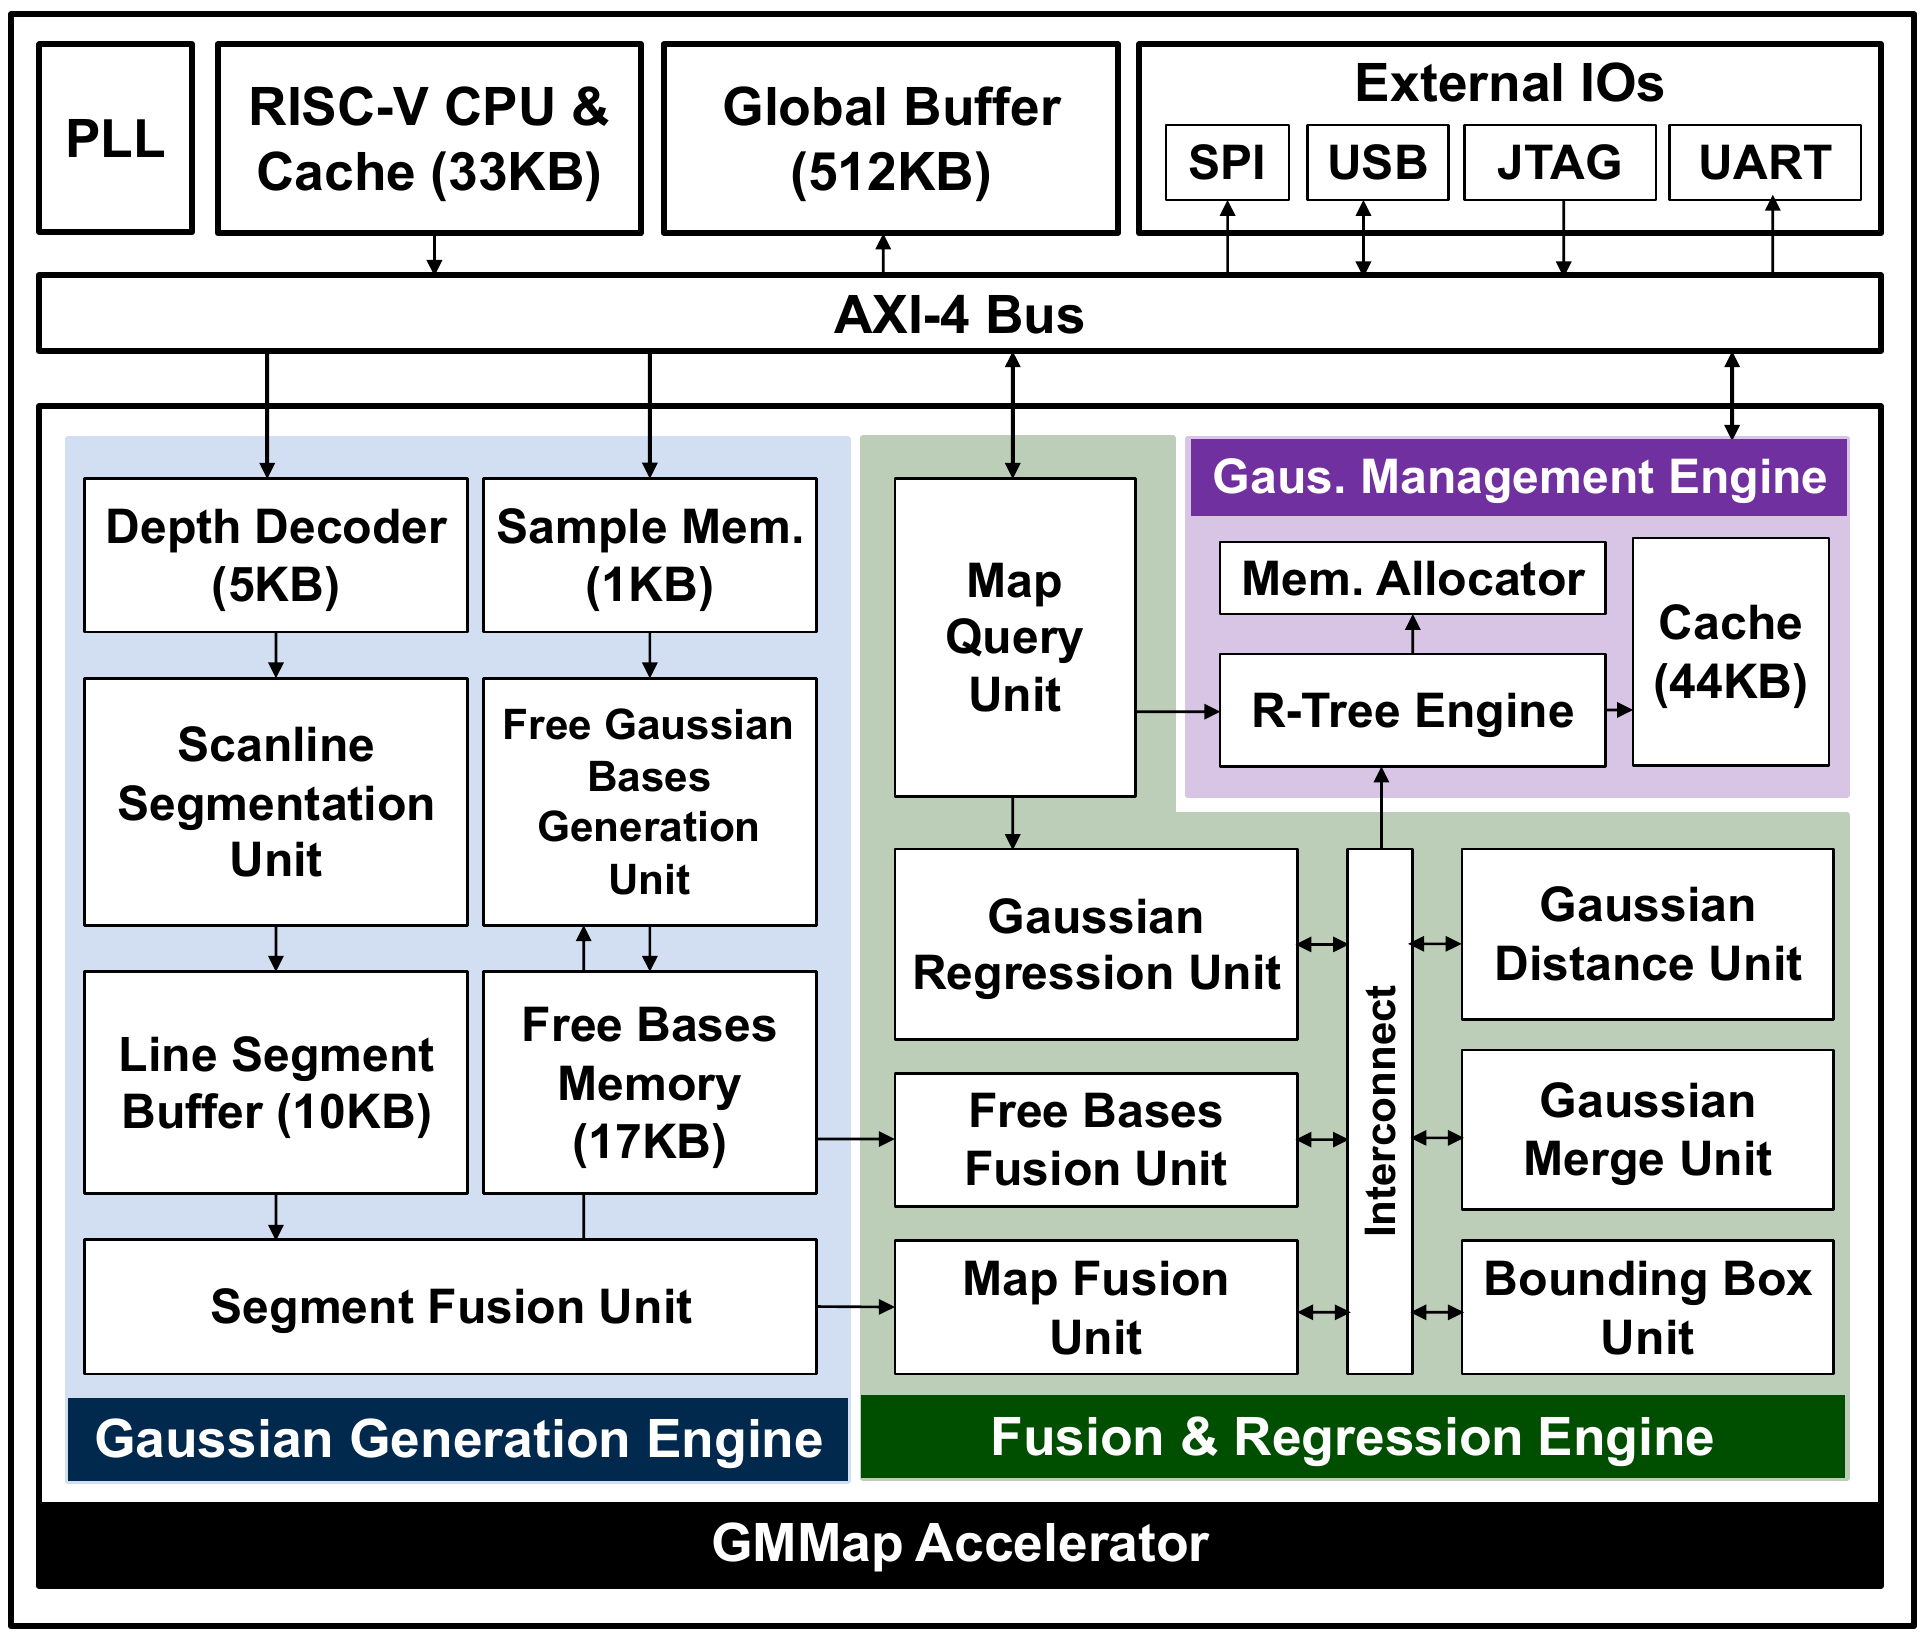
Gleanmer accelerates this pipeline with three processing engines. Gaussian generation converts sensor measurements into local map elements. Gaussian management organizes access to the map. Fusion and regression respectively update the map and estimate occupancy at requested positions. Its 622 KB of on-chip static random-access memory (SRAM) holds the map, sensor data, and intermediate representations. The mapping operations therefore need no off-chip dynamic random-access memory (DRAM).
As co-first author, I co-led the chip design, designed the Gaussian generation and management engines, and executed the ASIC flow through tape-out.
The architecture places Gaussian generation on the left and fusion and regression on the right. The management engine retrieves and organizes the stored Gaussians. A RISC-V processor configures the accelerator. The mapping engines perform its specialized computations.
Gleanmer exploits the correlation of occupied and free space within each image, and the locality of Gaussian accesses across images and queries. It also uses fewer bits for selected Gaussian parameters while retaining higher precision where needed. These properties guide the construction and query hardware, reducing data movement and arithmetic costs.
The co-design starts with the representation: the hardware computes directly on Gaussians and reuses them across queries. Choosing what to store, regenerate, and approximate changes both memory traffic and circuit cost.
Mapping demonstrations and throughput limits
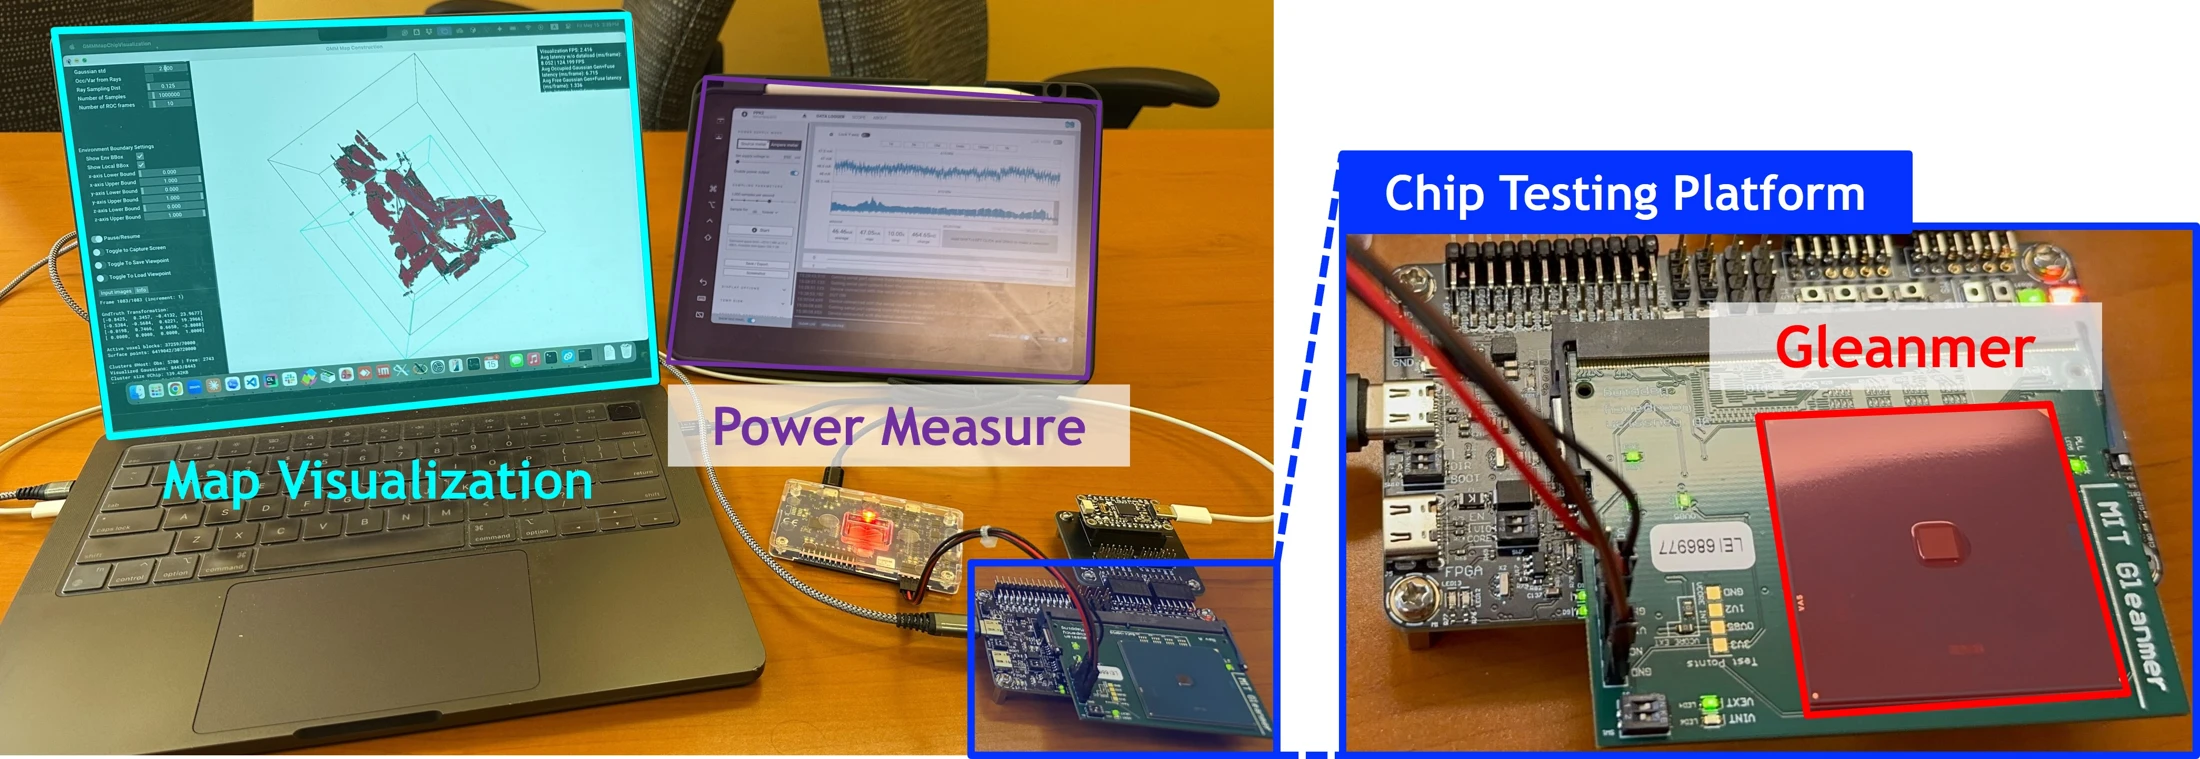
In the MIT Stata Center demonstration, depth images are streamed into the chip, and the resulting occupancy map is visualized externally. Red Gaussians mark occupied regions; blue Gaussians mark observed free space. The camera and overhead views display both local geometry and the accumulated map.
The demonstration processes slightly fewer than 60 frames per second because image transfer is limited by interface bandwidth. The chip’s evaluated construction throughput is 88–331 frames per second, separate from the interface-limited demonstration rate. The demonstration is an end-to-end validation of the interface, mapping hardware, and visualization, rather than a measurement of the accelerator’s maximum throughput.
The VLSI conference demonstration additionally shows the physical testing platform and a live current trace. These recordings demonstrate operation of the fabricated mapping chip with its external measurement and visualization systems. Demonstration descriptions.
Results and scope
The fabricated chip retains useful spatial structure while constructing and querying maps at under 6 mW of core power. Room covers a real indoor office with cubicles. Soulcity models a structured city with buildings and walkways; Gascola models an unstructured forest. Both outdoor scenes are simulated.
Occupancy map cross-sections
The horizontal slices below show how the maps distinguish obstacles, observed free space, and unexplored regions. Red marks occupied space, blue marks free space, and yellow marks unexplored space. Green dashed boxes connect each slice to a detailed 3D inset, where red Gaussian contours represent local occupied geometry.
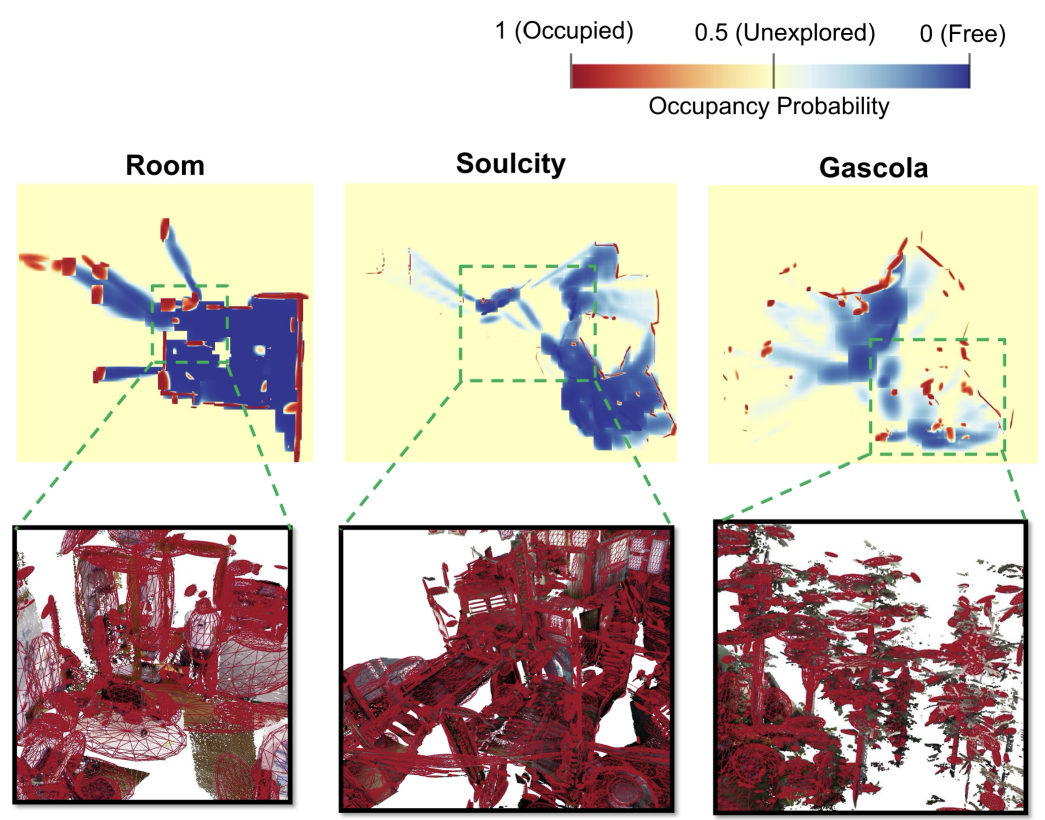
These examples illustrate the range of geometry represented by the same mapping hardware. Across these evaluated environments, the published work reports 96–99% area under the receiver operating characteristic curve (AUROC). AUROC quantifies discrimination between occupied and free regions across decision thresholds.
Power at comparable accuracy
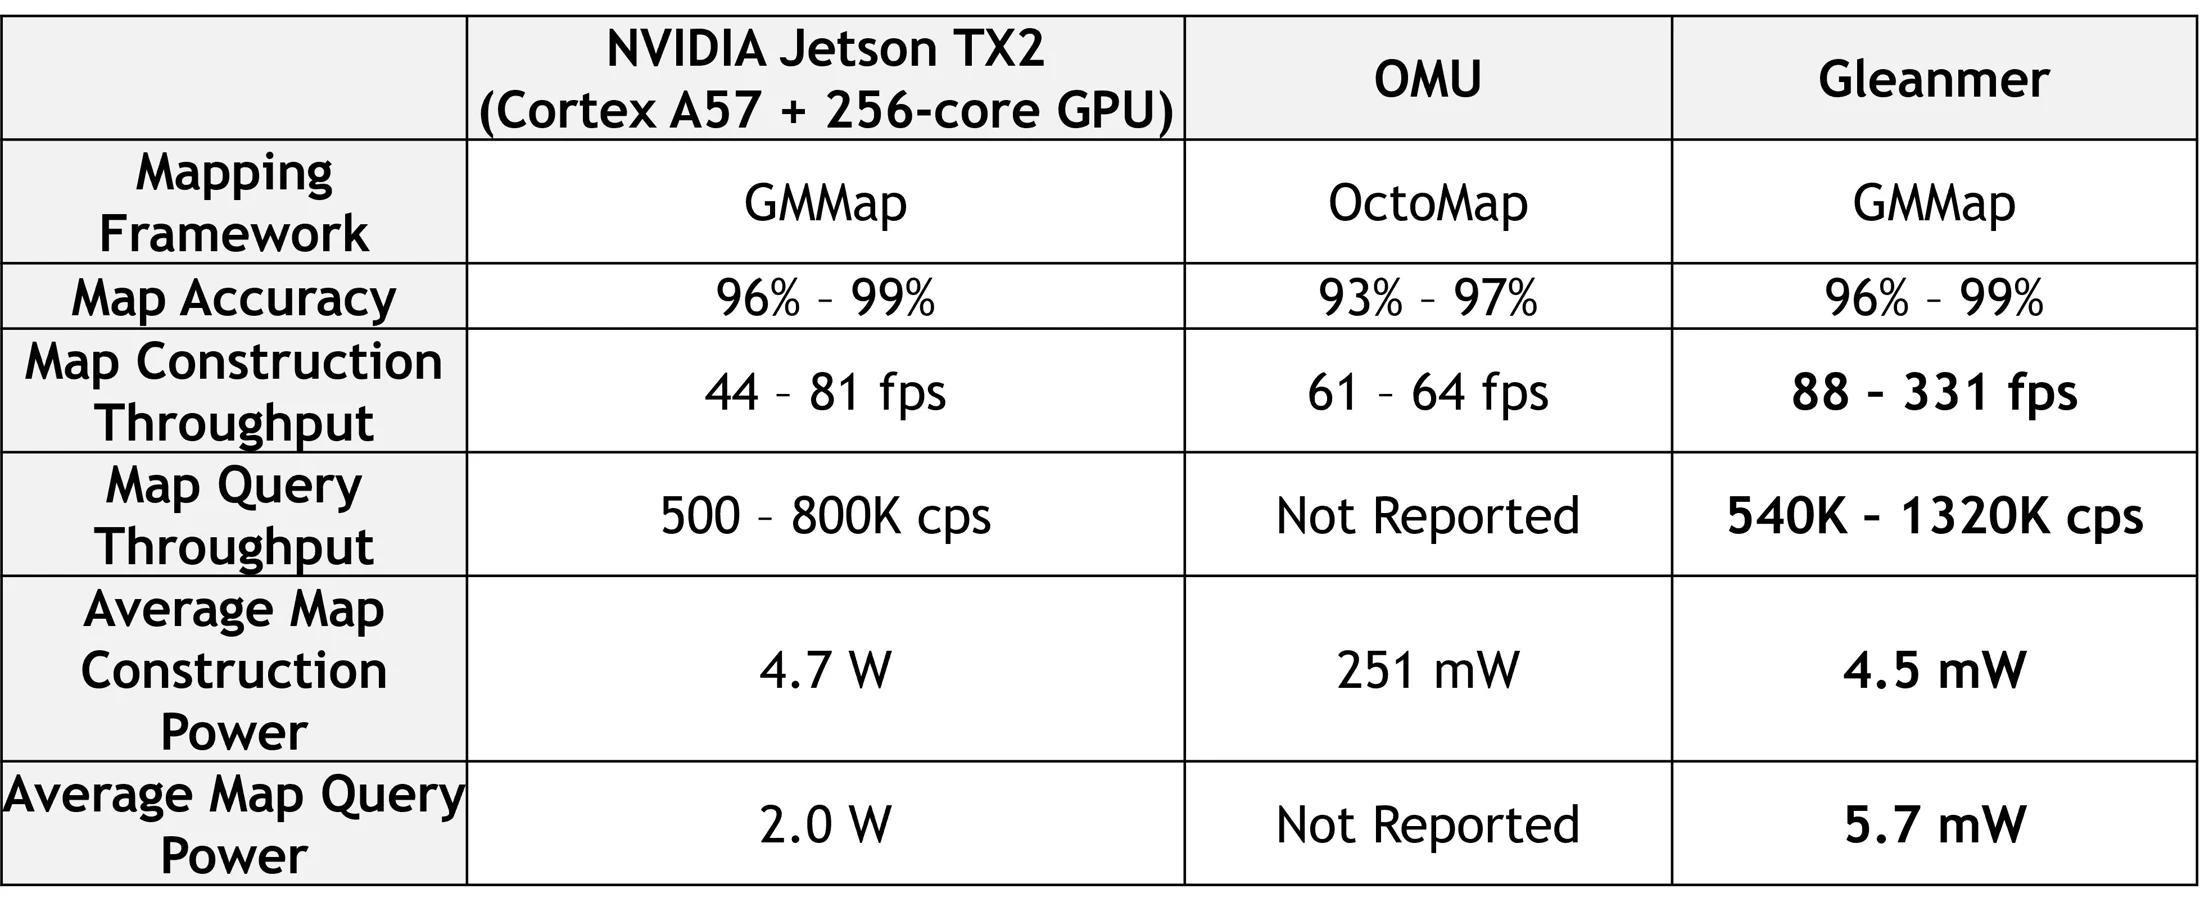
At comparable accuracy, core power is at least 341 times lower than a Jetson TX2 running GMMap. It is 44 times lower than OMU, the prior occupancy-mapping accelerator used in the comparison. The paper documents the workloads and operating conditions for these task-specific comparisons.
Live conference demonstration
Cite this work
Gleanmer: A 6 mW SoC for Real-Time 3D Gaussian Occupancy Mapping
BibTeX
@inproceedings{fu2026gleanmer,
  author = {Fu, Zih-Sing and Li, Peter Zhi Xuan and Karaman, Sertac and Sze, Vivienne},
  title = {{Gleanmer}: A 6 {mW} {SoC} for Real-Time {3D} Gaussian Occupancy Mapping},
  booktitle = {IEEE/JSAP Symposium on VLSI Technology and Circuits},
  year = {2026},
  doi = {10.1109/VLSITechnologyandCir65830.2026.11577349},
  note = {First two authors contributed equally. Best Demo Award}
}Related research